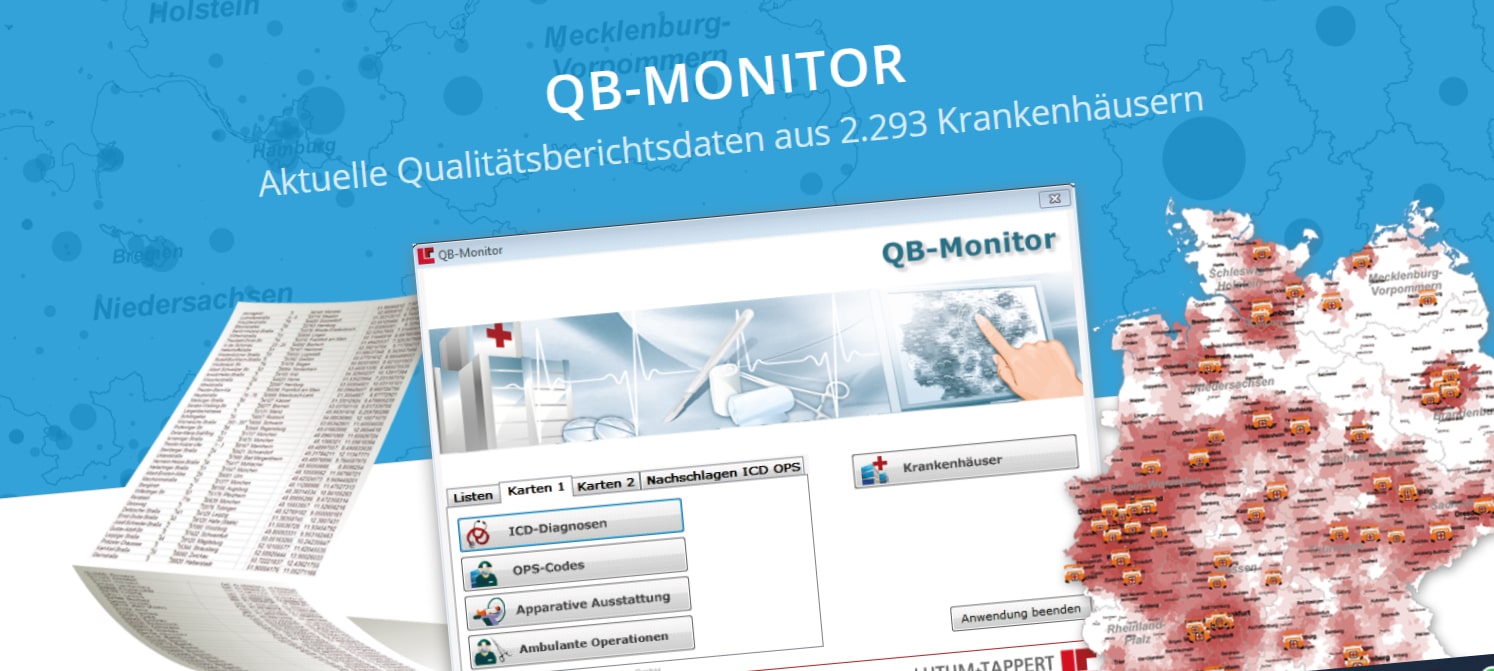
NEWS . QB-Monitor updated: Quality data on hospitals
Master data, case and treatment figures, operations, equipment/personnel, etc.
In the QB-Monitor, we consolidate the facts and figures from the annual quality reports of hospitals in Germany, prepare and evaluate them, and make them available as data sets and as digital maps. The update with the latest available figures (from 2019) is now available on the corresponding web portal.
The QB-Monitor (= Quality Report Monitor) gives you access to all data provided by hospitals, always down to the department level. The spatial distribution of hospitals, treatment figures per hospital and other key figures are shown in the integrated maps. These maps can be exported, e.g. to PowerPoint slides, at the click of a button. Free evaluations according to ICD, OPS and equipment can be output as Excel tables.
You can receive the QB-Monitor
- as a complete analysis package for preparing the 2019 quality reports or
- as an analysis of the 2019 quality reports according to your specific specifications (based on the QB Monitor).
As always, our consultants will be happy to assist you. Call us right away at +49 228 99591491 or send an email directly to vertrieb@easymap.one.
This post is also available in: DE


