Dynamic and easy: Time series reports with easymap
View the development of your data in dynamic time series reports with easymap.
Identify developments and regional dynamics through time series analysis.
Dynamic developments often cannot be depicted in a single map, but are a sequence of changing representations. In order to be able to evaluate regionally measurable successes for new product launches, for example, it makes sense to track developments in “real time”. In this way, changes can be reacted to in a more targeted and timely manner. Potentials of new product lines can be better observed and supported by evaluating them according to time series. Furthermore, by observing time intervals, changes in sales figures can be recognized in time and allow for an early introduction of countermeasures.
The time intervals are divided into days, weeks up to months, depending on the requirements and the question. The observation of individual months makes it possible to monitor seasonal trends over time. With appropriate further calculations, forecasts can also be made to better assess the market and make business decisions.
Business Case I: Monthly sales development
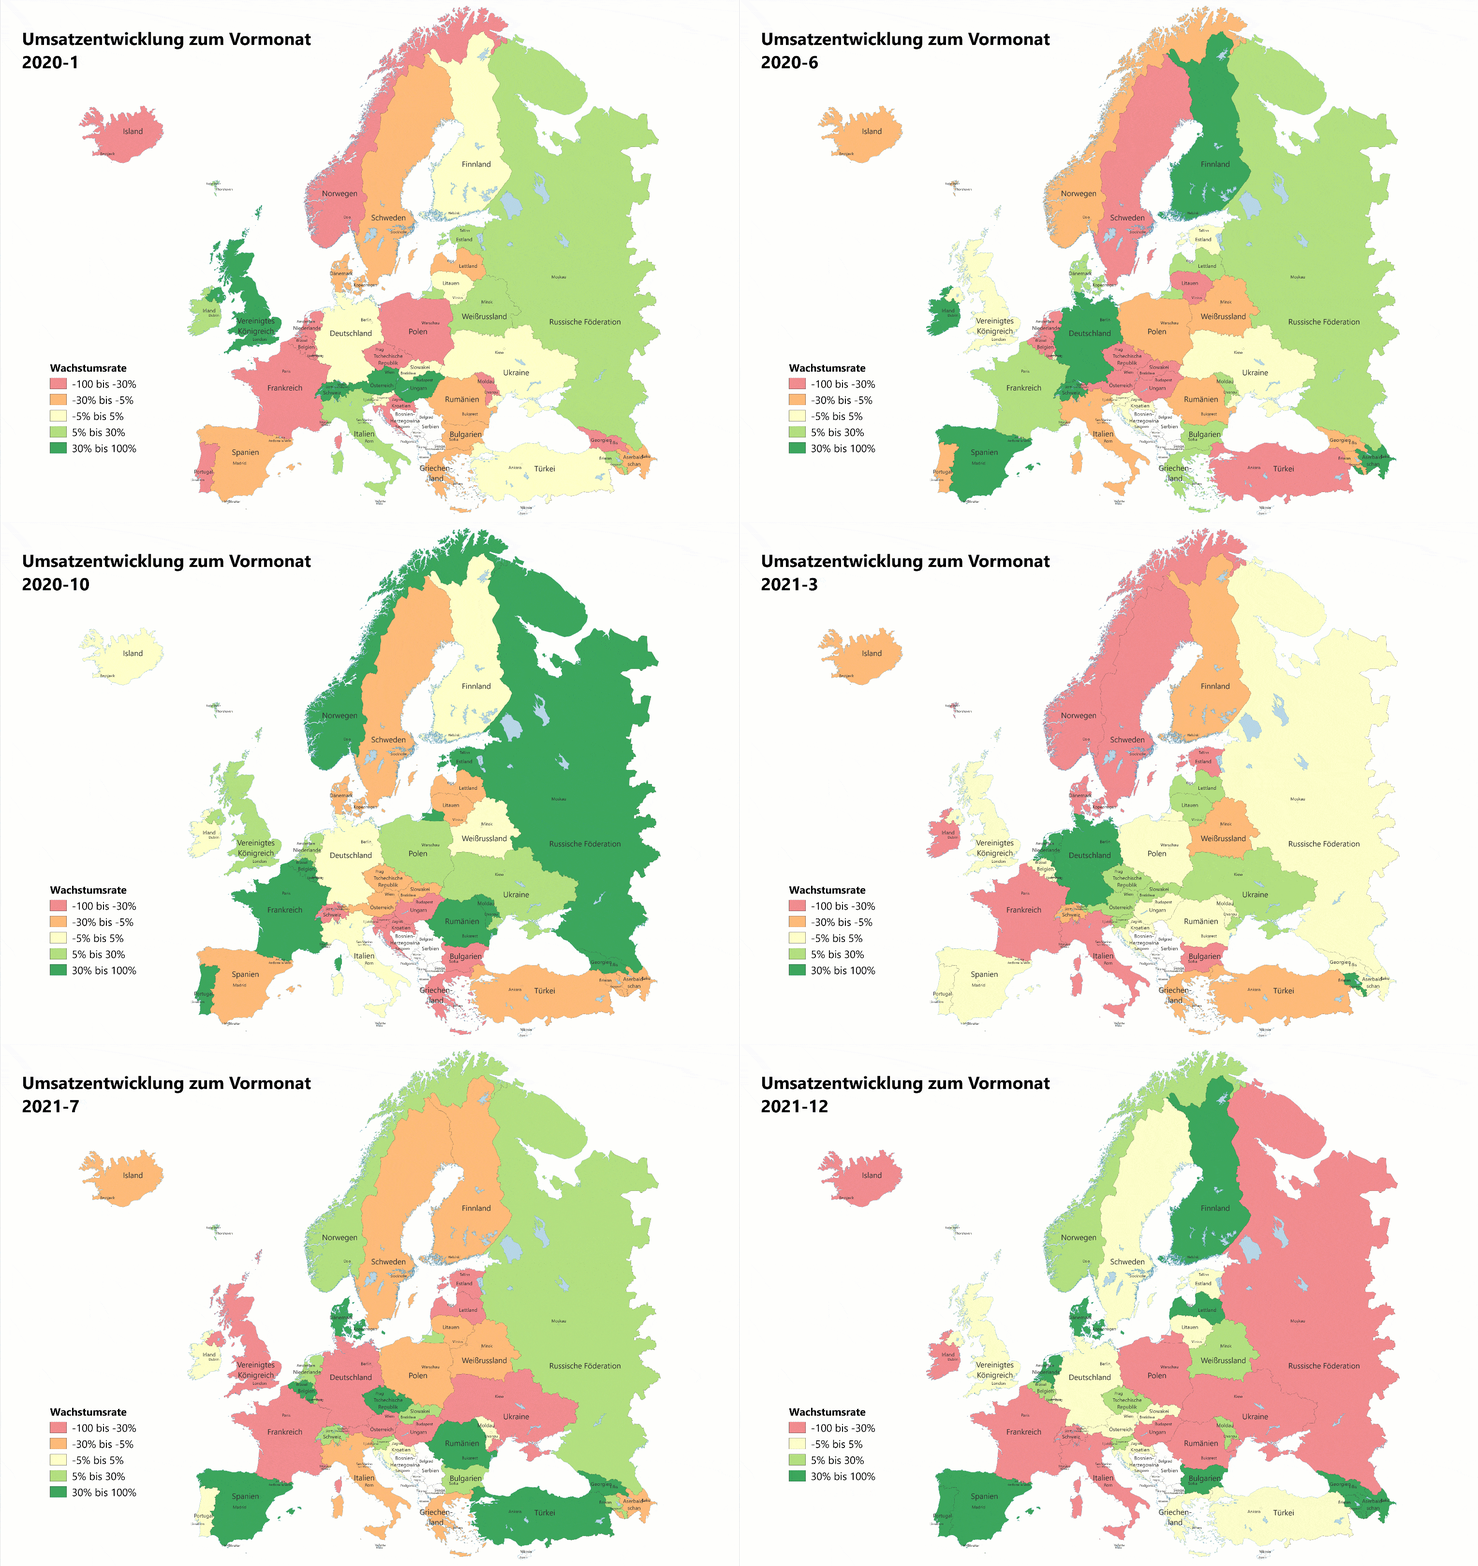
Using a time series analysis, this example looks at the sales development of a company operating across Europe. The sales figures were recorded by individual months in the period from 2020 to 2021. As an analysis, we use a simple area coloring here and calculate the development of the sales figures compared to the previous month as the data value. The green colors indicate a 5% to 30% and 30% to 100% increase in sales from the previous month. The yellow colors indicate the countries that have recorded constant sales figures (-5% to 5%). The orange and red colors indicate that sales have decreased by 5% to 30% and 30% to 100% respectively compared to the previous month.
Business Case II: Development of customer structure, highlighting of potentials
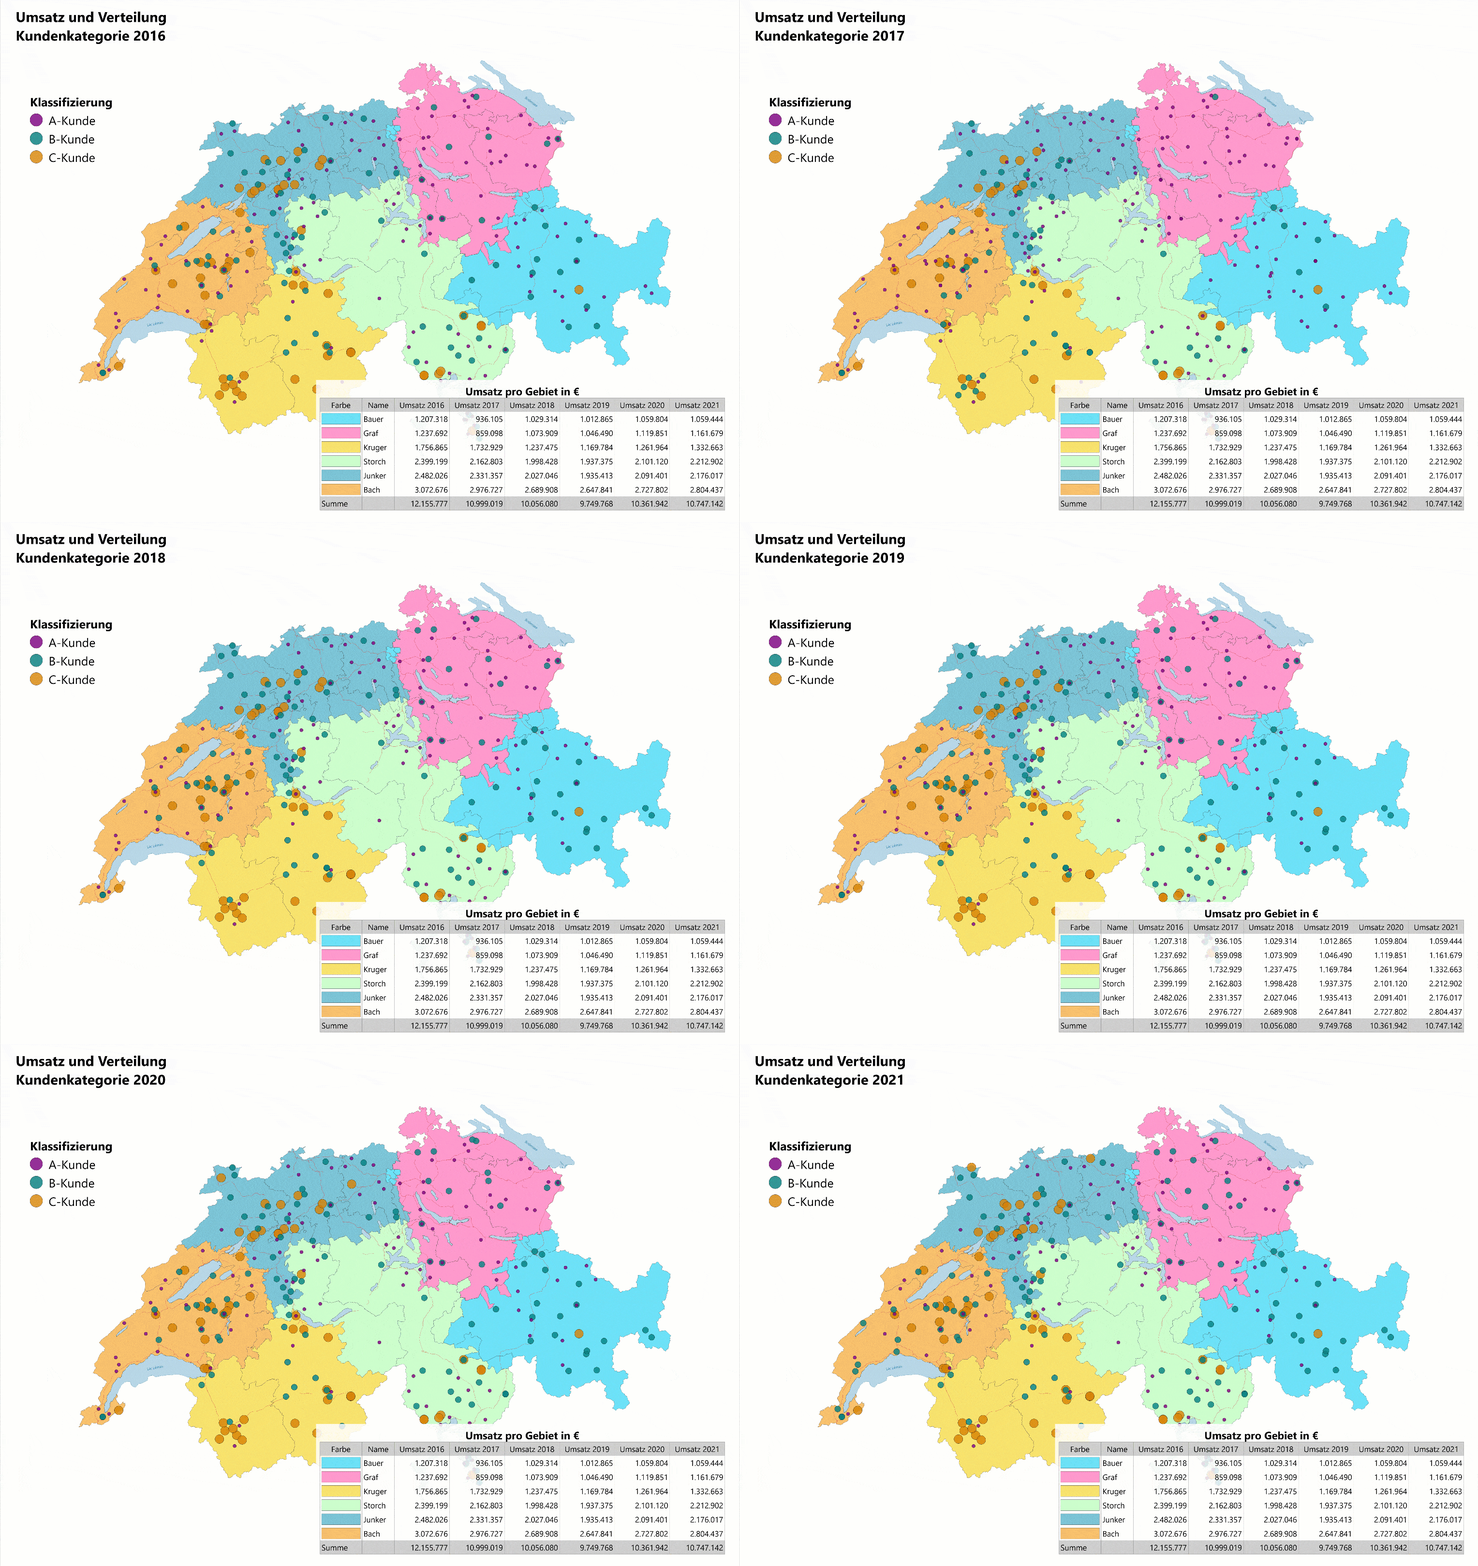
A time series report is also suitable for analyzing the company’s own customers and highlighting potential. In this example, the customers were divided into A, B and C customers. The classification depends on the sales figures achieved with the respective customer per year. A customers correspond to the highest annual sales, C customers to the lowest. The table calculates the total revenue for each sales territory per year as well as the total revenue in the sum of all sales territories. The time series report created here in the example shows the development of sales and customer categories over a period of six years. The clear juxtaposition of the individual years makes developments and trends as well as potentials clearly visible.
Creating a time series in easymap
It doesn’t matter what data you want to use for this: the sales figures of the last few years, the number of new customers in the last few months, the completed orders of the last week or the weather data of the last 24 hours. However, the data all have one thing in common. They have documented a data series of the same value at the same intervals.
To create a time series in easymap, you need a column report. The data series is read into easymap for this purpose – each time interval in its own column. For the evaluation and visualization of your data you can select any analysis, for example area coloring, heatmap, symbol analysis or relationship analysis. Classify your data as usual and design your analysis according to your wishes. Your analysis serves as a template for your time series and should therefore provide a suitable result for all time intervals as standard. When you create the report, it exchanges the data values for all selected time intervals and creates a separate map for each interval. You get a variety of maps that reflect the course of your data and make correlations clear.
You can now output and present the maps as PDF or image files. For a perfect presentation, let the individual maps run past in a kind of slide show to show the direct change. Read more about column reports in our easymap support portal.
Questions?
If you have any questions about reporting options with easymap or a corresponding offer for our software, please feel free to contact our sales department by e-mail at Vertrieb@infas-LT.de or by phone at +49 228 9591490.
On the topic of reports: Read also our article about area reports in easymap and easymap explorer.
This post is also available in: DE


