
Reviewing Sales Territories: 3 Warning Signs That Your Territory Structure No Longer Fits
Uneven utilisation, shifting market potential or increasing travel times can indicate that a territory structure is no longer performing optimally. These three warning signs deserve closer attention.

Sales territories rarely change from one day to the next. Customers are added, potential shifts, employees change – and at some point, the original territory structure no longer fits the current conditions.
Three signs should therefore be looked at more closely:
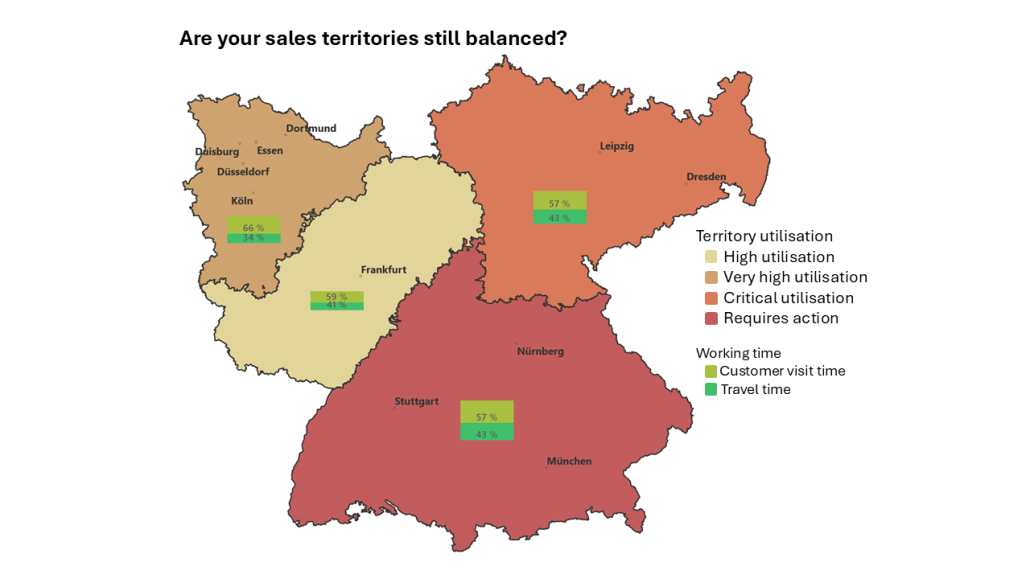
1. The utilisation of field sales employees is becoming uneven
A clear warning sign is persistently uneven utilisation across the field sales team. While some employees can barely manage all their planned customer visits, others have spare capacity.
Short-term differences are completely normal. They become problematic when these differences persist over a longer period of time.
The causes do not necessarily lie in the way individual employees work. Often, the conditions within the territories have changed:
- The customer base has grown more strongly in some regions.
- New customers and business opportunities have been added.
- Visit frequencies or customer support requirements have changed.
- Economic developments have shifted regional areas of focus.
As a result, a territory structure that was originally well balanced can gradually become uneven.
The consequences are not only organisational. Overloaded employees have less capacity for additional customer contacts, while available capacity in other territories may not be fully utilised.
If the workload differs significantly and persistently between comparable sales territories, it is therefore worth taking a closer look at the underlying territory structure.
2. The distribution of potential no longer matches the territory structure
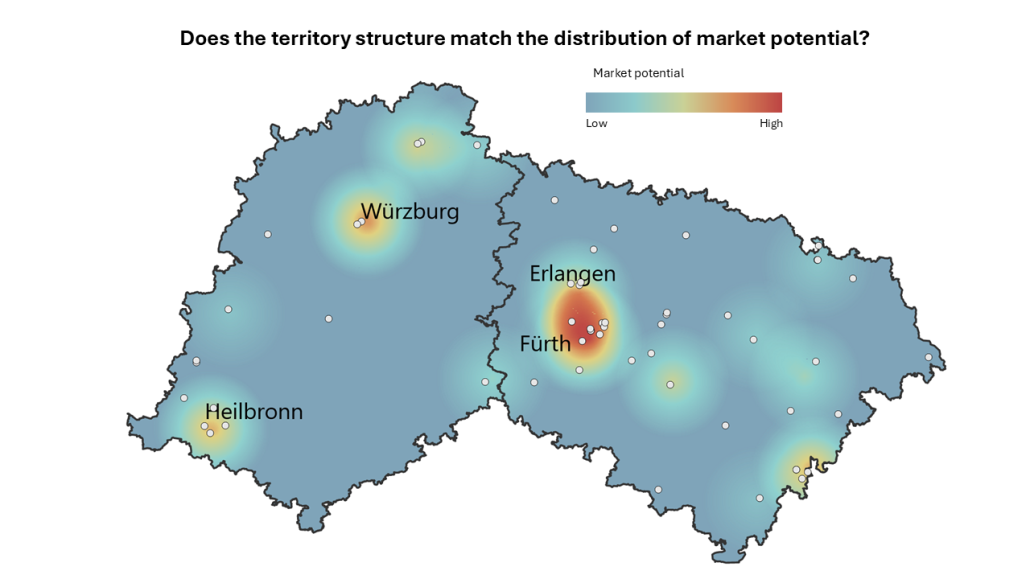
Not every sales territory offers the same market opportunities. What matters, therefore, is not only how many customers are assigned to an employee, but also the potential within their territory.
For example, one territory may include a large number of attractive existing customers and potential new customers, while another offers significantly fewer business opportunities.
These differences often develop gradually. Market potential changes, companies grow or disappear, new target groups emerge and regional developments shift the economic importance of individual territories.
This can mean that sales performance is increasingly influenced by the starting position of the respective territory.
Typical signs include:
- Individual territories consistently offer significantly more revenue or customer potential than others.
- Target achievement differs considerably between territories.
- Particularly attractive customer groups are concentrated in just a few regions.
- Employees manage territories with very different market opportunities.
In such situations, looking at sales performance alone is not always sufficient. Customer structures and market potential should also be taken into account to put these differences into context.
Regularly analysing the distribution of potential makes it possible to see whether today’s territory planning still match the actual market opportunities.
3. More and more working time is being lost to travel time
The development of travel times can also be an indication that a territory structure is no longer working optimally.
Historically grown territories can, for example, mean that customers are spread far apart or that territory boundaries no longer fit the current customer structure. As a result, field sales employees spend more time travelling and less time with their customers.
This is not just about the distance itself. What matters is how much of the available working time can actually be used for customer contact. A study by Ruhr University Bochum and Mercuri International shows the importance of travel time in field sales and how much time can be taken up by travelling.
Three questions can provide an initial assessment:
- How much time does field sales actually spend with customers?
- How much working time is spent travelling?
- How well do the current territory boundaries fit the geographical distribution of customers?
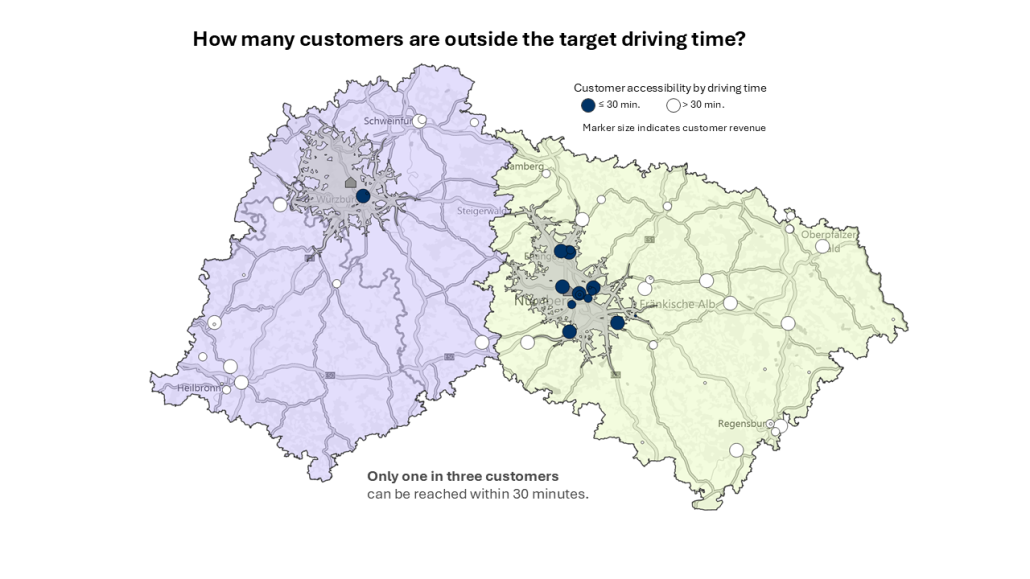
If travel times increase while visit frequency or the time available for customers decreases, this may indicate optimization potential within the territory structure.
This relationship is particularly relevant in field sales: efficient tour planning can help reduce unnecessary travel time and create more time for customer visits, advice and support.
Regularly review sales territories
A territory structure should not only be questioned once significant problems arise. Regular reviews help identify changes at an early stage and respond in a targeted way.
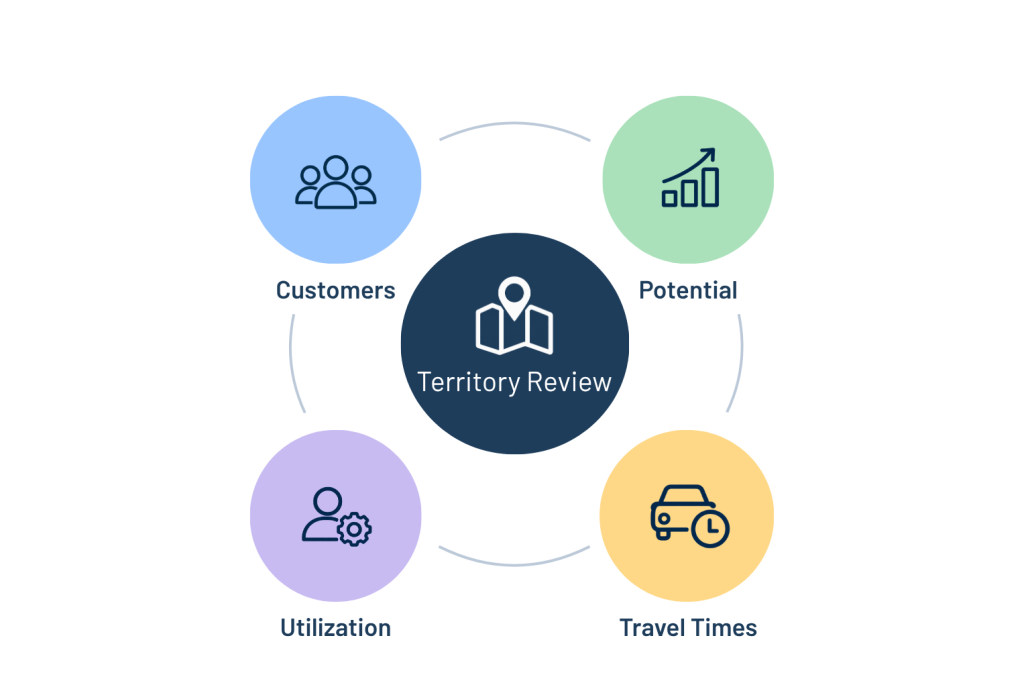
Different factors should be considered together: customer bases, market potential, visit requirements, employee capacity, geographical distribution and travel times.
A data-based analysis helps to look beyond individual anomalies and identify connections between the different factors.
For example, it can be used to assess whether a heavily utilised territory actually contains too many customers, has particularly high visit requirements or has been structured unfavourably. It can also reveal whether spare capacity is related to lower market potential or an unfavourable customer distribution.
Such a review does not necessarily have to result in a complete redesign. Sometimes targeted adjustments to individual territories are enough to balance workloads, distribute potential more effectively or reduce travel times.
Sales territories should grow with the market.
By identifying changes in utilization, potential or travel times at an early stage, existing structures can be reviewed and adjusted before small imbalances become bigger problems.
Our article Territory Planning in Field Sales: The Most Common Mistakes shows how professional territory planning can support the systematic analysis, evaluation and optimization of sales territories.
If you would like to analyse your existing sales territories and identify potential areas for optimization, we can support you with easymap, individual consulting and joint project support.
Building High-Performing Territory Structures with Our Support
Do your sales territories still match your customers, potential and current requirements? We support you in analysing existing territory structures based on data and identifying potential areas for optimization.
Whether using our software, through individual consulting and training or as part of a joint project: together, we look at customer structures, potential, utilization and geographical distribution and develop suitable solutions for your field sales team.
Get in touch with us – by email at vertrieb@infas360.de or by phone on +49 228 9591491. Or book an online presentation directly and discover easymap.
Find out more about our software for territory planning and field sales optimization at easymap.one.
This post is also available in: DE

 @infas360